Introduction
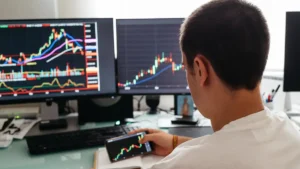
Technical analysis is a methodology used to predict the future direction of prices based on historical market data, primarily prices and trading volumes. In the cryptocurrency market, technical analysis is widely used due to the volatile and unpredictable nature of digital assets. This guide is designed for intermediates who wish to enhance their technical analysis skills and gain a deeper understanding of the available tools and techniques.
What is Technical Analysis?
Definition of Technical Analysis
Technical analysis is the practice of evaluating and predicting future price movements based on historical price and volume data. Unlike fundamental analysis, which focuses on external and intrinsic factors, technical analysis exclusively focuses on market behavior.
Principles of Technical Analysis
- Price Discounts Everything: All factors, including news, events, and market sentiment, are reflected in the market price.
- Price Movements in Trends: Prices tend to move in trends, which can be upward, downward, or sideways.
- History Repeats Itself: Price patterns tend to repeat over time, allowing analysts to predict future movements.
Basic Tools and Indicators
Price Charts
Charts are the foundation of technical analysis, providing a visual representation of price data over time. The main types of charts include:
- Line Charts: Connect closing prices for each period.
- Bar Charts: Show opening, high, low, and closing prices.
- Candlestick Charts: Similar to bar charts but with a more visually intuitive format.
Support and Resistance
Support and resistance levels are fundamental in technical analysis.
- Support: A price level where demand is strong enough to prevent the price from falling further.
- Resistance: A price level where supply is strong enough to prevent the price from rising further.
Moving Averages
Moving averages smooth out price data to create a single trend line and help identify the overall direction of price movement. Common types of moving averages include:
- Simple Moving Average (SMA): Calculates the average price over a specific period.
- Exponential Moving Average (EMA): Gives more weight to recent prices, making it more sensitive to new information.
Advanced Technical Indicators
Relative Strength Index (RSI)
The RSI is a momentum indicator that measures the speed and change of price movements. It is calculated on a scale of 0 to 100 and helps identify overbought or oversold conditions.
MACD (Moving Average Convergence Divergence)
The MACD is a trend-following indicator that shows the relationship between two moving averages. It is used to identify changes in the strength, direction, momentum, and duration of a trend.
Bollinger Bands
Bollinger Bands consist of a moving average and two standard deviation lines. They help identify periods of high and low volatility and potential trend reversals.
Chart Patterns
Continuation Patterns
Continuation patterns indicate that the current trend is likely to continue after a brief consolidation period. Examples include:
- Triangles: Ascending, descending, and symmetrical.
- Flags and Pennants: Small consolidation formations indicating a temporary pause in the trend.
Reversal Patterns
Reversal patterns indicate a change in the current trend. Examples include:
- Head and Shoulders: Indicates a reversal from an uptrend to a downtrend.
- Double Top and Double Bottom: Indicators of trend reversal appearing after a prolonged uptrend or downtrend.
Market Psychology
Investor Sentiment
Market psychology plays a crucial role in technical analysis. Investor behavior can significantly influence price movements.
Dow Theory
Dow Theory is a fundamental basis of technical analysis, stating that prices move in trends that can be identified and exploited. The principles include:
- Prices Discount Everything.
- The Market Has Three Main Movements: Primary, secondary, and tertiary.
- Primary Trends Have Three Phases: Accumulation, public participation, and distribution.
Trading Strategies
Day Trading
Day trading involves buying and selling assets within the same trading day. It is a short-term strategy that requires rigorous technical analysis and quick decision-making.
Swing Trading
Swing trading seeks to capture gains in an asset within a few days to several weeks. It is based on identifying “swings” in the market.
Scalping
Scalping is a short-term strategy that aims to make small profits continuously throughout the day. It involves making many buy and sell transactions in a single trading day.
Risk Management
Definition of Risk
Risk management is the practice of identifying, analyzing, and mitigating the risks associated with market operations. In the cryptocurrency market, risk management is essential due to its high volatility.
Stop Loss and Take Profit
Stop Loss and Take Profit are essential risk management tools that help limit losses and secure profits.
- Stop Loss: An order to sell an asset when it reaches a specific price to limit losses.
- Take Profit: An order to sell an asset when it reaches a specific price to secure profits.
Diversification
Diversification is the practice of spreading investments across various asset classes to reduce risk. In the cryptocurrency market, this can involve trading different coins and tokens to minimize exposure to risk.
Conclusion
Technical analysis is a powerful tool in the arsenal of any cryptocurrency trader. By understanding the basic and advanced principles, utilizing technical tools and indicators, recognizing chart patterns, and applying effective trading strategies, intermediates can significantly improve their skills and increase their chances of success in the cryptocurrency market.
We hope this guide has provided a clear and practical understanding of technical analysis in the context of cryptocurrencies. Always remember to keep learning and practicing, as technical analysis is a skill that improves over time and experience.
This post is designed to help intermediates deepen their knowledge and skills in technical analysis, providing a comprehensive and detailed guide that can be directly applied in their daily trading activities. If you have any questions or need more information, feel free to leave a comment below!
References
- Investopedia: Technical Analysis
- CoinMarketCap: Technical Analysis/Trend Analysis (TA)
- TradingView: Education
Technical analysis is a continuous journey of learning and practice. With dedication and study, any trader can become proficient in this art and increase their chances of success in the volatile world of cryptocurrencies. Good luck and happy trading!
Disclaimer – Informational Content, Not Investment Advice
Content provided herein is solely for informational purposes and should not be construed as a recommendation, endorsement, or suggestion to engage in any form of investment activity. The information presented in this post is not intended to serve as financial, legal, tax, or investment advice.
About the Author: CryptoTrends Team
With over five years of diving deep into cryptocurrencies and blockchain, we’ve cemented our position as experts in the digital currency realm. Our team has not only contributed to a multitude of pioneering blockchain projects but has also enlightened thousands with our incisive articles CryptoTrends. Always at the cutting edge of crypto trends, we proudly collaborate with CryptoBotStation, ensuring our readers stay one step ahead in this dynamic space.