Crypto Market Analysis & Trend: Neutral/Trending Down
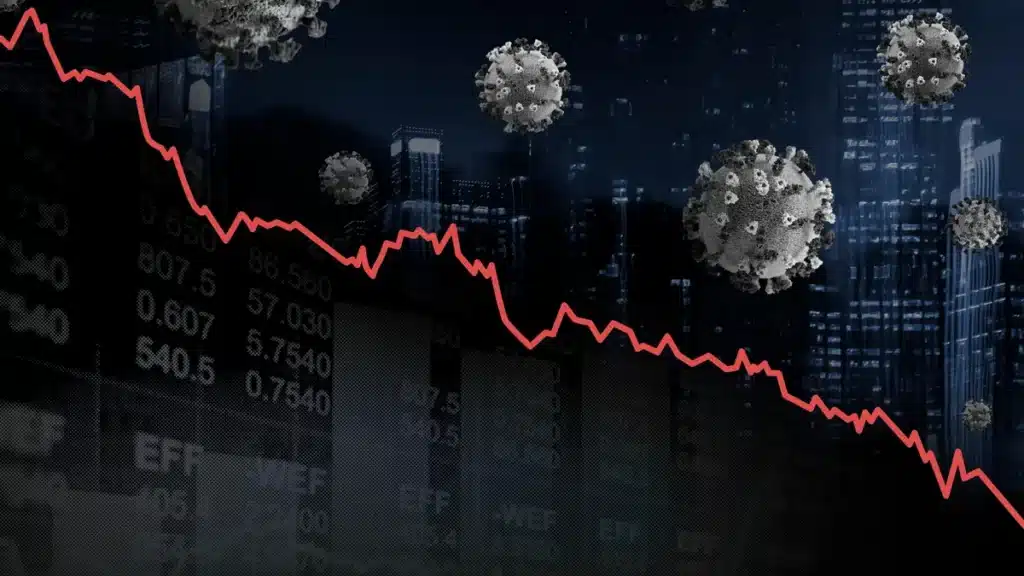
The crypto market has shifted from strong upward momentum to a more cautious stance over the past few days. Bitcoin’s price, for example, pulled back from $80,279.96 on August 27, 2026, to $78,234.01 by August 29. On August 29, Bitcoin saw a 24-hour variation of 0.50%, but a more significant -3.16% on August 28. This decline hit other major cryptocurrencies too: Ethereum fell 2.88% on August 28, and Binance Coin dropped 2.98% the same day. This suggests a broad market pullback after recent highs.
Market capitalization data confirms this trend. Bitcoin’s capitalization fell 3.10% to $1,561,385,718,960 on August 29. Ethereum’s capitalization dropped 2.74% to $294,657,425,911 the same day. Ripple saw the biggest hit, with a 4.78% decline in capitalization. These figures show a reduction in total value across these assets. However, Bitcoin’s trading volume climbed 8.88% to $36,380,633,001, and Tether’s volume rose 2.59% to $65,143,089,115 on August 29. Increased volume during a market decline often signals selling pressure.
Investor sentiment, tracked by the Fear and Greed Index, has also softened. While still in ‘greed’ territory, the index dropped from 73pt on August 28 to 68pt on August 29, according to Alternative.me and Milkroad.com. Coinstats.app showed even higher ‘extreme greed’ levels, hitting 83pt on August 28 before settling at 76pt by August 29. This shift from extreme to lower greed, combined with price and capitalization declines, signals cooling bullish sentiment. Bitcoin’s hash rate also saw a significant drop, falling 9.63% to 826.20B GB on August 29, after a 3.89% decline on August 28. This could mean miners are reacting to changing profitability or market conditions. Declining prices, market caps, and softening sentiment suggest a neutral to trending down outlook for the next 8 hours, with moderate confidence given recent sharp movements and mixed trading volumes.
What is important
The crypto market is contracting, with Bitcoin, Ethereum, and Ripple all seeing price and market capitalization declines on August 29, 2026. Bitcoin’s price fell to $78,234.01, and its market cap dropped 3.10%.
Investor sentiment has shifted from ‘extreme greed’ to ‘greed,’ with the Fear and Greed Index registering 68pt on August 29. This shows less market exuberance. Despite price drops, Bitcoin and Tether trading volumes increased, possibly signaling active selling.
Bitcoin mining activity changed notably, with the hash rate decreasing 9.63% on August 29. This might reflect a response to market conditions or a re-evaluation of mining profitability. The market is pulling back from recent highs, and participants are showing increased caution.
Top 5 – Latest Headlines & Cryptocurrency News
👍 Ethereum ETFs just logged $1.42 billion in nine days and BlackRock bought every single one of them
– BlackRock´s Ethereum ETF has seen significant inflows, accumulating $1.42 billion over a nine-day streak. This strong performance highlights growing investor interest in Ethereum-based investment products, suggesting a positive outlook for the cryptocurrency´s market adoption and potential price appreciation.
👍 Russia´s Largest Bank Opens Door to Bitcoin, Ethereum and USDT-Backed Loans
– Russia´s largest bank, Sberbank, is exploring the possibility of offering loans backed by cryptocurrencies like Bitcoin, Ethereum, and USDT. This move signifies a potential shift in traditional finance´s approach to digital assets, opening doors for crypto-backed financial products and services within a major banking institution.
👎 Bitcoin ETFs Snap 9-Day Streak With $202M Exit as Ether Gains $102M
– Bitcoin ETFs experienced a significant outflow of $202 million, marking a substantial shift in investor sentiment. This contrasts with Ether, which saw an inflow of $102 million. The data suggests a potential rotation or a broader market concern impacting Bitcoin´s performance, while Ether shows resilience.
👎 Bitcoin Price Retreats After Warsh´s Hawkish Jackson Hole Keynote
– Bitcoin´s price experienced a retreat following Federal Reserve Chair Jerome Powell´s hawkish remarks at the Jackson Hole Economic Symposium. Powell´s speech signaled a commitment to continued interest rate hikes to combat inflation, dampening investor sentiment and leading to a decline in the cryptocurrency´s value.
👍 Chelsea Names Circle´s USDC as New Front-of-Shirt Sponsor
– Chelsea Football Club has announced a new front-of-shirt sponsorship deal with Circle, the principal operator of the USD Coin (USDC) stablecoin. This partnership marks a significant move into mainstream sports for the cryptocurrency industry, with the USDC logo set to be prominently displayed on the team´s jerseys starting next season. The collaboration is expected to increase visibility for both Chelsea and Circle.
Factors Driving the Growth – Market Sentiment
Keyword analysis over the last 24 hours shows mixed sentiment, with ‘bitcoin’ and ‘cryptocurrency’ appearing frequently in both positive and negative contexts. Positive mentions include ‘xrp’ (3 occurrences), ‘cashback’ (3 occurrences), and ‘coinbase ceo’ (3 occurrences), pointing to specific growth areas and institutional interest. News about ‘ethereum etfs’ also boosted sentiment, with BlackRock seeing significant inflows of $1.42 billion over nine days. On the negative side, ‘stablecoins’ (2 occurrences) and ‘ai’ (1 occurrence) came up, often in discussions of cybersecurity threats or regulatory concerns. The term ‘warsh’ appeared in negative news, linked to Bitcoin price drops after hawkish speeches, showing macroeconomic factors are influencing crypto market sentiment.
Positive Terms – Sentiment Analysis
| Occurrences | Keyword |
|---|---|
| 12 | bitcoin |
| 7 | cryptocurrency |
| 3 | cashback |
| 3 | coinbase ceo |
| 3 | ethereum |
| 3 | xrp |
| 3 | xrp etfs |
| 2 | cardone capital |
| 2 | circle |
| 2 | coinbase |
Negative Terms – Sentiment Analysis
| Occurrences | Keyword |
|---|---|
| 9 | cryptocurrency |
| 4 | bitcoin |
| 2 | stablecoins |
| 1 | agustín carstens |
| 1 | ai |
| 1 | arrests |
| 1 | audited protocols |
| 1 | ban |
| 1 | banking system |
| 1 | billion |
Crypto Investor Fear & Greed Index
The Fear and Greed Index shows a shift in market sentiment over the past few days. On August 27, 2026, the index hit 71pt, firmly in ‘greed’ territory, according to Alternative.me, BitDegree.org, and Milkroad.com. It then rose slightly to 73pt on August 28 from these sources, staying in ‘greed.’ Coinstats.app reported even higher levels, reaching 83pt early on August 28, putting it in ‘extreme greed.’ By August 29, however, the index fell to 68pt (Alternative.me, Milkroad.com) and 76pt (Coinstats.app), pulling back from ‘extreme greed’ into ‘greed.’ This means market participants remain generally optimistic, but some recent exuberance has diminished.
| Date | Value | Variation | Source |
|---|---|---|---|
| 2026-08-29 00:00:00 | 68pt | -5pt | Alternative.me |
| 2026-08-28 00:00:00 | 73pt | 2pt | Alternative.me |
| 2026-08-27 00:00:00 | 71pt | 0pt | Alternative.me |
| 2026-08-28 00:00:00 | 73pt | 2pt | BitDegree.org |
| 2026-08-27 00:00:00 | 71pt | 0pt | BitDegree.org |
| 2026-08-29 02:30:00 | 76pt | -1pt | Coinstats.app |
| 2026-08-29 00:10:01 | 77pt | -1pt | Coinstats.app |
| 2026-08-29 00:00:00 | 78pt | 1pt | Coinstats.app |
| 2026-08-28 19:00:00 | 77pt | -1pt | Coinstats.app |
| 2026-08-28 16:30:00 | 78pt | -1pt | Coinstats.app |
| 2026-08-28 16:10:00 | 79pt | -1pt | Coinstats.app |
| 2026-08-28 10:10:00 | 80pt | -3pt | Coinstats.app |
| 2026-08-28 01:10:00 | 83pt | 2pt | Coinstats.app |
| 2026-08-28 00:10:00 | 81pt | -1pt | Coinstats.app |
| 2026-08-28 00:00:01 | 82pt | 0pt | Coinstats.app |
| 2026-08-27 09:30:00 | 82pt | 3pt | Coinstats.app |
| 2026-08-27 01:30:00 | 79pt | -1pt | Coinstats.app |
| 2026-08-27 00:10:00 | 80pt | -1pt | Coinstats.app |
| 2026-08-27 00:00:00 | 81pt | 0pt | Coinstats.app |
| 2026-08-29 00:00:00 | 68pt | -5pt | Milkroad.com |
| 2026-08-28 00:00:00 | 73pt | 2pt | Milkroad.com |
| 2026-08-27 00:00:00 | 71pt | 0pt | Milkroad.com |
Bitcoin: Active Addresses
Bitcoin address indicators show a stable, slightly increasing, number of total addresses. On August 29, 2026, total addresses hit 1,540,209,661, with minimal 0.00% variation throughout the day, according to bitaps.com. Addresses with zero balance also stayed largely stable, totaling 1,483,481,096 on the same date with no significant variation. Similarly, addresses holding various amounts of Bitcoin, from over 0.0000001 BTC to over 100,000 BTC, showed negligible daily variations, mostly at 0.00% or 0.01%. This points to consistent underlying network growth without dramatic shifts in wallet distribution. The ‘Bitcoin Active Addresses’ indicator from btc.com, however, reported 0 addresses for all dates provided, indicating a data reporting gap for this specific metric.
| Date | Addresses | Variation | Indicator | Source |
|---|---|---|---|---|
| 2026-08-29 23:00:00 | 1,540,209,661 | 0.00% | Total Addresses | bitaps.com |
| 2026-08-29 23:00:00 | 1,483,481,096 | 0.00% | Zero Balance Addresses | bitaps.com |
| 2026-08-29 23:00:00 | 541,148 | 0.00% | Addresses with over 0 | bitaps.com |
| 2026-08-29 23:00:00 | 219,433 | 0.00% | Addresses with over 0.0000001 | bitaps.com |
| 2026-08-29 23:00:00 | 4,957,811 | 0.00% | Addresses with over 0.000001 | bitaps.com |
| 2026-08-29 23:00:00 | 12,184,147 | 0.00% | Addresses with over 0.00001 | bitaps.com |
| 2026-08-29 23:00:00 | 14,011,773 | 0.01% | Addresses with over 0.0001 | bitaps.com |
| 2026-08-29 23:00:00 | 12,099,765 | 0.01% | Addresses with over 0.001 | bitaps.com |
| 2026-08-29 23:00:00 | 8,251,699 | 0.00% | Addresses with over 0.01 | bitaps.com |
| 2026-08-29 23:00:00 | 3,491,519 | 0.00% | Addresses with over 0.1 | bitaps.com |
| 2026-08-29 23:00:00 | 821,589 | 0.00% | Addresses with over 1 | bitaps.com |
| 2026-08-29 23:00:00 | 129,590 | 0.01% | Addresses with over 10 | bitaps.com |
| 2026-08-29 23:00:00 | 18,089 | 0.01% | Addresses with over 100 | bitaps.com |
| 2026-08-29 23:00:00 | 1,912 | 0.00% | Addresses with over 1,000 | bitaps.com |
| 2026-08-29 23:00:00 | 86 | 0.00% | Addresses with over 10,000 | bitaps.com |
| 2026-08-29 23:00:00 | 4 | 0.00% | Addresses with over 100,000 | bitaps.com |
Crypto Assets Prices
Cryptocurrency prices have seen a notable downturn recently. Bitcoin’s price, at $80,279.96 on August 27, 2026, fell to $77,711.95 by August 28, marking a -3.30% price variation and a -3.16% 24-hour variation. By August 29, it recovered slightly to $78,234.01, with a 0.67% price variation, but its 24-hour volatility stayed relatively high at 1.22%. Ethereum followed suit: its price hit $2,438.60 on August 28, down 3.05% from the prior day, with 24-hour volatility at 5.36%. Binance Coin also saw a -3.16% price variation on August 28, trading at $690.61, and 24-hour volatility of 5.05%. These figures show a general price retreat for major cryptocurrencies, alongside fluctuating volatility.
| Date | Cryptocurrency | Price | Price Variation | 24h Variation | 24h Variation Difference | 24h Volatility | 24h Volatility Difference |
|---|---|---|---|---|---|---|---|
| 2026-08-29 23:35:00 | Bitcoin | 78,234.01 | 0.67% | 0.50% | 3.66% | 1.22% | -4.75% |
| 2026-08-28 23:35:00 | Bitcoin | 77,711.95 | -3.30% | -3.16% | -4.75% | 5.97% | 3.04% |
| 2026-08-27 23:35:00 | Bitcoin | 80,279.96 | 1.73% | 1.59% | 1.14% | 2.93% | 0.85% |
| 2026-08-28 23:35:00 | Ethereum | 2,438.60 | -3.05% | -2.88% | -3.13% | 5.36% | 1.95% |
| 2026-08-27 23:35:00 | Ethereum | 2,512.91 | 0.56% | 0.24% | -2.05% | 3.42% | 0.00% |
| 2026-08-27 23:35:00 | Binance Coin | 712.45 | 0.95% | 0.70% | -0.92% | 2.10% | -0.31% |
| 2026-08-28 23:35:00 | Binance Coin | 690.61 | -3.16% | -2.98% | -3.68% | 5.05% | 2.95% |
Cryptocurrency Capitalization and Volume
Major cryptocurrency market capitalizations declined on August 29, 2026. Bitcoin’s capitalization dropped 3.10% to $1,561,385,718,960, while its volume climbed 8.88% to $36,380,633,001. Ethereum’s capitalization fell 2.74% to $294,657,425,911, and its volume decreased 3.11%. Ripple saw the most significant capitalization decline among altcoins, down 4.78% to $86,782,379,392, with its volume also falling 15.84%. Binance Coin’s capitalization dropped 2.95% to $92,030,396,781, though its volume increased 10.24%. Tether, a stablecoin, held relatively steady with a minimal 0.02% capitalization decrease, while its volume rose 2.59%. This points to a broad market contraction in value, with some assets seeing increased trading activity likely driven by selling.
| Date | Cryptocurrency | Capitalization | Capitalization Variation | Volume | Volume Variation |
|---|---|---|---|---|---|
| 2026-08-29 00:00:00 | Binance Coin | 92,030,396,781 | -2.95% | 903,905,676 | 10.24% |
| 2026-08-28 00:00:00 | Binance Coin | 94,830,340,379 | 0.65% | 819,916,241 | -9.64% |
| 2026-08-27 00:00:00 | Binance Coin | 94,218,148,344 | 1.96% | 907,393,422 | -14.59% |
| 2026-08-29 00:00:00 | Bitcoin | 1,561,385,718,960 | -3.10% | 36,380,633,001 | 8.88% |
| 2026-08-28 00:00:00 | Bitcoin | 1,611,376,122,286 | 1.54% | 33,412,956,007 | 17.32% |
| 2026-08-27 00:00:00 | Bitcoin | 1,587,005,062,360 | 0.65% | 28,479,558,524 | -33.59% |
| 2026-08-29 00:00:00 | Ethereum | 294,657,425,911 | -2.74% | 15,008,129,550 | -3.11% |
| 2026-08-28 00:00:00 | Ethereum | 302,962,754,639 | 0.20% | 15,489,316,073 | 26.75% |
| 2026-08-27 00:00:00 | Ethereum | 302,367,763,064 | 2.63% | 12,220,066,229 | -20.53% |
| 2026-08-29 00:00:00 | Ripple | 86,782,379,392 | -4.78% | 3,021,790,311 | -15.84% |
| 2026-08-28 00:00:00 | Ripple | 91,136,022,303 | 2.23% | 3,590,366,786 | -9.08% |
| 2026-08-27 00:00:00 | Ripple | 89,151,612,955 | -0.90% | 3,949,063,374 | -3.57% |
| 2026-08-29 00:00:00 | Tether | 183,350,385,664 | -0.02% | 65,143,089,115 | 2.59% |
| 2026-08-28 00:00:00 | Tether | 183,383,490,608 | 0.01% | 63,499,912,032 | 21.60% |
| 2026-08-27 00:00:00 | Tether | 183,357,731,052 | 0.08% | 52,222,354,552 | -25.69% |
Cryptocurrency Exchanges Volume and Variation
Trading volumes across major crypto exchanges showed mixed but generally upward trends on August 29, 2026. Binance recorded 149,280 in volume, up 8.46% from the prior day. Bybit jumped a significant 20.15% to 27,776, and Kraken’s volume rose 24.30% to 22,290. Gate.io also saw a substantial 19.42% increase to 23,751. Coinbase, however, bucked the trend with a slight 1.97% decrease to 28,663. Binance US, Bitfinex, Crypto.com, KuCoin, and OKX all reported positive volume variations, ranging from 5.26% to 10.68%. The overall increase in trading activity on most exchanges suggests heightened market participation, even amid recent price declines for some assets.
| Date | Exchange | Volume | Variation |
|---|---|---|---|
| 2026-08-29 00:00:00 | Binance | 149,280 | 8.46% |
| 2026-08-28 00:00:00 | Binance | 137,634 | 15.49% |
| 2026-08-27 00:00:00 | Binance | 119,179 | -21.02% |
| 2026-08-29 00:00:00 | Binance US | 342 | 10.68% |
| 2026-08-28 00:00:00 | Binance US | 309 | 17.49% |
| 2026-08-27 00:00:00 | Binance US | 263 | -42.83% |
| 2026-08-29 00:00:00 | Bitfinex | 4,066 | 10.43% |
| 2026-08-28 00:00:00 | Bitfinex | 3,682 | 20.25% |
| 2026-08-27 00:00:00 | Bitfinex | 3,062 | -29.79% |
| 2026-08-29 00:00:00 | Bybit | 27,776 | 20.15% |
| 2026-08-28 00:00:00 | Bybit | 23,118 | 21.70% |
| 2026-08-27 00:00:00 | Bybit | 18,996 | -30.63% |
| 2026-08-29 00:00:00 | Coinbase | 28,663 | -1.97% |
| 2026-08-28 00:00:00 | Coinbase | 29,240 | 31.09% |
| 2026-08-27 00:00:00 | Coinbase | 22,305 | -28.94% |
| 2026-08-29 00:00:00 | Crypto.com | 15,019 | 6.38% |
| 2026-08-28 00:00:00 | Crypto.com | 14,118 | -2.14% |
| 2026-08-27 00:00:00 | Crypto.com | 14,427 | -12.11% |
| 2026-08-29 00:00:00 | Gate.io | 23,751 | 19.42% |
| 2026-08-28 00:00:00 | Gate.io | 19,889 | 21.39% |
| 2026-08-27 00:00:00 | Gate.io | 16,385 | -41.73% |
| 2026-08-29 00:00:00 | Kraken | 22,290 | 24.30% |
| 2026-08-28 00:00:00 | Kraken | 17,932 | 17.00% |
| 2026-08-27 00:00:00 | Kraken | 15,326 | -21.77% |
| 2026-08-29 00:00:00 | KuCoin | 19,047 | 5.26% |
| 2026-08-28 00:00:00 | KuCoin | 18,096 | 16.63% |
| 2026-08-27 00:00:00 | KuCoin | 15,516 | -13.01% |
| 2026-08-29 00:00:00 | OKX | 28,540 | 9.66% |
| 2026-08-28 00:00:00 | OKX | 26,027 | 27.11% |
| 2026-08-27 00:00:00 | OKX | 20,476 | -31.41% |
Mining – Blockchain Technology
Bitcoin mining indicators show stable difficulty but a notable hash rate drop. Mining difficulty held constant at 125.81T from August 26 to August 29, 2026, with no reported daily change. On August 25, difficulty saw a -1.31% variation. The reward per BTC block stayed at 3.13 BTC with 0.00% variation from August 29 to August 23. Mined blocks showed minor daily increases, with 964.50K blocks on August 29, up 0.01% from the prior day. However, the hash rate dropped significantly, falling 9.63% to 826.20B GB on August 29, after a 3.89% decrease on August 28. This suggests a reduction in computational power dedicated to the Bitcoin network, potentially due to changing profitability or operational factors.
| Item | 2026-08-29 | 2026-08-28 | 2026-08-27 | 2026-08-26 | 2026-08-25 | 2026-08-24 | 2026-08-23 |
|---|---|---|---|---|---|---|---|
| Difficulty | 125.81T | 125.81T | 125.81T | 125.81T | 125.81T | 127.48T | 127.48T |
| Difficulty Variation | 0.00% | 0.00% | 0.00% | 0.00% | -1.31% | 0.00% | 0.00% |
| Blocks | 964.50K | 964.36K | 964.22K | 964.07K | 963.92K | 963.78K | 963.65K |
| Blocks Variation | 0.01% | 0.02% | 0.02% | 0.01% | 0.01% | 0.01% | 0.02% |
| Reward BTC | 3.13 | 3.13 | 3.13 | 3.13 | 3.13 | 3.13 | 3.13 |
| Reward BTC Variation | 0.00% | 0.00% | 0.00% | 0.00% | 0.00% | 0.00% | 0.00% |
| Hash Rate GB | 826.20B | 914.28B | 951.30B | 888.71B | 888.71B | 850.92B | 939.15B |
| Hash Rate GB Variation | -9.63% | -3.89% | 7.04% | 0.00% | 4.44% | -9.39% | 8.06% |
Taking stock
The crypto market is adjusting after a period of heightened optimism. Recent price movements for Bitcoin, Ethereum, and other major assets show a clear retreat from previous highs, with Bitcoin dropping from over $80,000 to around $78,000 by August 29, 2026. This price action comes with a corresponding decline in market capitalizations across the board, pointing to a broad reduction in asset valuations.
Investor sentiment, though still in ‘greed’ territory, has softened considerably from ‘extreme greed’ levels seen earlier in the week. This shift in the Fear and Greed Index, along with a notable decrease in Bitcoin’s hash rate, suggests the market is becoming more cautious. While some exchange volumes have increased, this might signal increased selling activity rather than renewed buying enthusiasm.
Despite the current downturn, positive developments persist, such as significant inflows into Ethereum ETFs and growing institutional interest in crypto-backed financial products. These factors suggest that while short-term market dynamics lean negative, long-term structural interest in digital assets remains intact. The market is processing recent gains and external macroeconomic signals, leading participants to a more measured approach.So What
Market participants should be more vigilant. Bitcoin’s price retreat from $80,279.96 on August 27 to $78,234.01 on August 29, along with similar declines in Ethereum and Ripple, shows recent bullish momentum has stalled. This isn’t a time for complacency; risk management is paramount.
The Fear and Greed Index shifted from extreme greed to a lower greed score, meaning the market is less euphoric. This often precedes further price corrections or consolidation. Traders might tighten stop-losses or re-evaluate positions, especially with Bitcoin’s hash rate dropping 9.63%. This could signal a change in mining economics or network health.
Long-term holders might see this as a healthy correction, but they should still watch for further downside. Increased trading volumes on some exchanges during a price decline could indicate selling pressure, potentially driving prices lower in the short term. The market is cooling off, and reacting to that cooling is key.
What next?
Over the next 8 hours, market participants should closely monitor Bitcoin’s price action around the $78,000 level, as it’s currently trading at $78,234.01. A sustained break below this could signal further downside. Watch for significant changes in the 24-hour variation and volatility for Bitcoin, Ethereum, and Binance Coin, which recently stood at 0.50%, -2.88%, and -2.98% respectively.
Watch the Fear and Greed Index. Its current 68pt reading suggests ‘greed,’ but any further drop toward the ‘fear’ zone (below 50pt) would signal a significant deterioration in market sentiment. Look for changes in exchange volumes, especially on Binance (149,280 volume on August 29) and Coinbase (28,663 volume), to gauge if buying or selling pressure is intensifying.
News related to macroeconomic factors, especially any further comments from figures like ‘Warsh’ that could influence interest rate hike odds, will be critical. Such events have previously led to Bitcoin price drops. Updates on Ethereum ETF inflows or XRP ETF filings could offer a positive counter-narrative, but the immediate focus should be on price stability and sentiment indicators.
Disclaimer – Informational Content, Not Investment Advice
Content provided herein is solely for informational purposes and should not be construed as a recommendation, endorsement, or suggestion to engage in any form of investment activity. The information presented in this post is not intended to serve as financial, legal, tax, or investment advice.
About the Author: CryptoTrends Team
With over five years of diving deep into cryptocurrencies and blockchain, we’ve cemented our position as experts in the digital currency realm. Our team has not only contributed to a multitude of pioneering blockchain projects but has also enlightened thousands with our incisive articles CryptoTrends. Always at the cutting edge of crypto trends, we proudly collaborate with CryptoBotStation, ensuring our readers stay one step ahead in this dynamic space.