
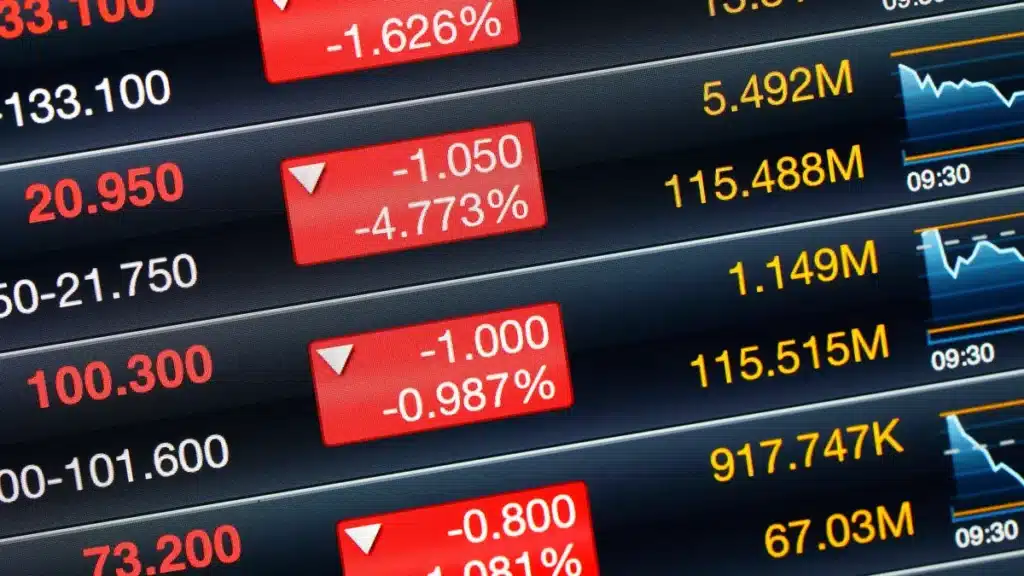
Crypto Market Analysis & Trend: Trending Down
The crypto market is trending down, driven by extreme fear and falling market caps for major assets. On November 20, 2026, the Fear and Greed Index held between 9 and 13 points across multiple sources, clearly showing ‘extreme fear’ among investors. This broad apprehension has weighed on asset performance.
Bitcoin’s market cap fell 1.76% on November 20, 2026, to $1,246,326,768,736. Ethereum’s cap also dropped 1.12% to $214,757,268,287. Binance Coin and Ripple saw similar declines, with their caps down 0.41% and 0.80% respectively. These widespread reductions in value for leading cryptocurrencies confirm the negative sentiment seen in the Fear and Greed Index.
Trading volumes across major exchanges are mixed, but asset values are still falling. Binance’s volume jumped 20.66% to 161,397 on November 20, 2026, while Coinbase’s volume climbed 11.51% to 29,903. This increased activity, alongside falling asset prices, suggests selling pressure, not accumulation. The frequent mentions of ‘bitcoin’ (25 times) and ‘outflows’ (6 times) in negative news keywords back this bearish view, implying recent volume comes from investors liquidating positions.
The market will likely stay under pressure over the next 8 hours. ‘Extreme fear,’ recent capitalization declines, and negative news on Bitcoin ETF outflows support this view. Bitcoin ETFs shed $975 million on November 19, according to crypto.news, with total November outflows nearing $2.9 billion as reported by CoinInsider.org. These significant withdrawals from institutional investment products signal a lack of confidence, which could keep prices down. The Consumer Sentiment Index, a moderate impact economic event scheduled for 15:00:00 on November 20, 2026, could add volatility, depending on its results. Given the on-chain data, market sentiment, and recent news, we’re moderately to highly confident in a continued downward or sideways trend for the next 8 hours.
What is important
The crypto market is gripped by ‘extreme fear,’ with the Fear and Greed Index consistently below 24 points on November 20, 2026, across multiple sources. This sentiment is driving investor behavior and market dynamics.
Major cryptocurrencies like Bitcoin, Ethereum, and Binance Coin saw market caps fall on November 20, 2026, with Bitcoin’s cap down 1.76%. This broad reduction in value for leading assets signals a market-wide contraction.
Significant Bitcoin ETF outflows, totaling $975 million on November 19 and nearing $2.9 billion for the month, show institutional selling pressure. This trend, plus frequent negative keywords like ‘outflows’ and ‘price’ in recent news, points to a cautious, potentially bearish environment.
Top 5 – Latest Headlines & Cryptocurrency News
👎 Bitcoin ETFs shed $975 million in a week as BTC slips 11%
– Bitcoin ETFs experienced significant outflows totaling $975 million on November 19th. This substantial withdrawal of funds from Bitcoin investment products suggests a bearish sentiment in the market, potentially impacting the price of Bitcoin. Investors are likely reacting to market conditions or seeking alternative investments.
👎 Bitcoin Price Slumps Under $62,000, Crashing 25% in One Month
– Bitcoin´s price has experienced a significant slump, falling below the $62,000 mark. This downturn follows a period of volatility in the cryptocurrency market, with investors closely monitoring the leading digital asset´s performance. The reasons behind this sharp decline are multifaceted, reflecting broader market dynamics and investor sentiment.
👎 US Bitcoin ETFs Lose $306.5 Million as November Outflows Near $2.9 Billion
– Bitcoin ETFs experienced significant outflows in November, nearing three billion dollars. This substantial withdrawal suggests a potential cooling of investor interest or a shift in market sentiment, impacting the cryptocurrency´s price trajectory. The data indicates a notable trend in institutional investment behavior within the digital asset space.
👎 Bitcoin´s $2.58B ETF outflows deepen November sell-off – Is $60K next?
– Bitcoin ETFs experienced significant outflows totaling $2.58 billion, exacerbating a November sell-off. This trend raises concerns about potential price drops, with speculation that $60,000 could be the next target if selling pressure continues. The market is closely watching these developments.
👎 S&P Global Maintains Lowest Stability Score for Tether´s USDT
– SP Global has assigned Tether´s USDT the lowest stability score among stablecoins, raising concerns about its reliability. This assessment highlights potential risks for investors and the broader cryptocurrency market, emphasizing the need for greater scrutiny of stablecoin stability and transparency.
Factors Driving the Growth – Market Sentiment
News analysis shows mixed but mostly negative sentiment in keyword mentions. ‘Bitcoin’ appeared 25 times in negative contexts, making it the most frequent negative keyword, compared to 16 times in positive contexts. Other prominent negative terms included ‘cryptocurrency’ (11 occurrences), ‘ethereum’ (7 occurrences), and ‘outflows’ (6 occurrences), pointing to concerns about asset values and capital movement. On the positive side, ‘cryptocurrency’ (10 occurrences) and ‘stablecoin’ (4 occurrences) appeared, along with ‘institutional adoption’ (3 occurrences), suggesting some underlying optimism for broader market integration, despite immediate price pressures.
Positive Terms – Sentiment Analysis
| Occurrences | Keyword |
|---|---|
| 16 | bitcoin |
| 10 | cryptocurrency |
| 4 | stablecoin |
| 4 | sui |
| 4 | usdt |
| 3 | blockchain |
| 3 | institutional adoption |
| 3 | market |
| 3 | pulsar |
| 3 | solana |
Negative Terms – Sentiment Analysis
| Occurrences | Keyword |
|---|---|
| 25 | bitcoin |
| 11 | cryptocurrency |
| 7 | ethereum |
| 6 | outflows |
| 6 | price |
| 5 | investors |
| 4 | market |
| 3 | bitcoin etfs |
| 3 | crypto |
| 3 | holders |
Crypto Investor Fear & Greed Index
The Fear and Greed Index consistently showed ‘extreme fear’ in the market over the past few days. On November 20, 2026, indicators from Alternative.me, Coinstats.app, and Milkroad.com all reported values from 9pt to 12pt. This follows similar readings on November 19, where values ranged from 10pt to 12pt, and on November 18, with values between 11pt and 13pt. The highest value recorded in this period was 13pt on November 18, 2026, from Coinstats.app, while the lowest was 9pt on November 20, 2026, also from Coinstats.app. These figures, all well within the 0-24 range, confirm a sustained period of high investor apprehension.
| Date | Value | Variation | Source |
|---|---|---|---|
| 2026-11-20 00:00:00 | 12pt | 2pt | Alternative.me |
| 2026-11-19 00:00:00 | 10pt | -1pt | Alternative.me |
| 2026-11-18 00:00:00 | 11pt | 0pt | Alternative.me |
| 2026-11-19 00:00:00 | 10pt | -1pt | BitDegree.org |
| 2026-11-18 00:00:00 | 11pt | 0pt | BitDegree.org |
| 2026-11-20 04:40:00 | 09pt | -1pt | Coinstats.app |
| 2026-11-20 00:00:00 | 10pt | 0pt | Coinstats.app |
| 2026-11-19 20:10:00 | 10pt | -1pt | Coinstats.app |
| 2026-11-19 00:10:00 | 11pt | -1pt | Coinstats.app |
| 2026-11-19 00:00:00 | 12pt | 1pt | Coinstats.app |
| 2026-11-18 16:30:00 | 11pt | -1pt | Coinstats.app |
| 2026-11-18 13:10:00 | 12pt | -1pt | Coinstats.app |
| 2026-11-18 00:00:00 | 13pt | 0pt | Coinstats.app |
| 2026-11-20 00:00:00 | 12pt | 2pt | Milkroad.com |
| 2026-11-19 00:00:00 | 10pt | -1pt | Milkroad.com |
| 2026-11-18 00:00:00 | 11pt | 0pt | Milkroad.com |
Bitcoin: Active Addresses
Bitcoin address indicators show a steady increase in total addresses, hitting 1,563,557,858 by 12:00:00 on November 20, 2026, according to bitaps.com. Addresses with over 0.0000001 BTC (219,422) and over 0.000001 BTC (5,036,821) showed minimal 0.00% variation on November 20, 2026. Larger holders, like those with over 1,000 BTC, saw minor fluctuations, with 1,945 addresses at 12:00:00 on November 20, 2026, with a 0.00% variation. The ‘Bitcoin Active Addresses’ indicator from btc.com showed zero for August 8, 2026, which doesn’t offer recent insight.
| Date | Addresses | Variation | Indicator | Source |
|---|---|---|---|---|
| 2026-11-20 12:00:00 | 1,563,557,858 | 0.00% | Total Addresses | bitaps.com |
| 2026-11-20 12:00:00 | 540,953 | 0.00% | Addresses with over 0 | bitaps.com |
| 2026-11-20 12:00:00 | 219,422 | 0.00% | Addresses with over 0.0000001 | bitaps.com |
| 2026-11-20 12:00:00 | 5,036,821 | 0.00% | Addresses with over 0.000001 | bitaps.com |
| 2026-11-20 12:00:00 | 12,379,057 | 0.00% | Addresses with over 0.00001 | bitaps.com |
| 2026-11-20 12:00:00 | 14,075,880 | 0.00% | Addresses with over 0.0001 | bitaps.com |
| 2026-11-20 12:00:00 | 12,126,599 | 0.00% | Addresses with over 0.001 | bitaps.com |
| 2026-11-20 12:00:00 | 8,287,947 | 0.00% | Addresses with over 0.01 | bitaps.com |
| 2026-11-20 12:00:00 | 3,498,546 | 0.00% | Addresses with over 0.1 | bitaps.com |
| 2026-11-20 12:00:00 | 825,877 | 0.00% | Addresses with over 1 | bitaps.com |
| 2026-11-20 12:00:00 | 130,228 | 0.00% | Addresses with over 10 | bitaps.com |
| 2026-11-20 12:00:00 | 18,197 | 0.00% | Addresses with over 100 | bitaps.com |
| 2026-11-20 12:00:00 | 1,945 | 0.00% | Addresses with over 1,000 | bitaps.com |
| 2026-11-20 12:00:00 | 86 | 0.00% | Addresses with over 10,000 | bitaps.com |
| 2026-11-20 12:00:00 | 4 | 0.00% | Addresses with over 100,000 | bitaps.com |
Economic events to move the cryptocurrency market
The global financial market had several economic events with varying impacts over the past two days. On November 19, 2026, high-impact events included Jobless Claims Initial Claims and the 4-Week Moving Average, both hit at 13:30:00. These figures offer insight into labor market health, influencing investor sentiment across all markets, including crypto. A moderate-impact Philadelphia Fed Manufacturing Index was also released at 13:30:00 on November 19, 2026, a regional economic snapshot. For November 20, 2026, a moderate-impact Consumer Sentiment Index is scheduled for 15:00:00, which will gauge consumer confidence and spending outlook, potentially affecting market liquidity and risk appetite.
| Date | Impact | Event |
|---|---|---|
| 2026-11-20 15:00:00 | Moderate | Consumer Sentiment Index |
| 2026-11-19 15:30:00 | Moderate | EIA Natural Gas Report Week over Week |
| 2026-11-19 13:30:00 | High | Jobless Claims Initial Claims – Change |
| 2026-11-19 13:30:00 | High | Jobless Claims 4-Week Moving Average |
| 2026-11-19 13:30:00 | High | Jobless Claims Initial Claims – Level |
| 2026-11-19 13:30:00 | Moderate | Philadelphia Fed Manufacturing Index Index |
Crypto Assets Prices
Crypto prices on November 19, 2026, at 13:00:00 saw mixed movements for major assets. Bitcoin’s price was $63,878.21, with a -0.33% price variation and a -0.10% 24-hour variation. Ethereum, however, saw a positive shift, with its price at $1,806.26, showing a 0.60% price variation and a 0.89% 24-hour variation. Binance Coin also edged up, priced at $592.52 with a 0.53% price variation and a 0.62% 24-hour variation. Volatility remained a factor, with Bitcoin’s 24-hour volatility at 3.27% and Ethereum’s at 4.66% on November 19, 2026. These figures show Bitcoin faced minor downward pressure, but Ethereum and Binance Coin managed small gains over the 24-hour period.
| Date | Cryptocurrency | Price | Price Variation | 24h Variation | 24h Variation Difference | 24h Volatility | 24h Volatility Difference |
|---|---|---|---|---|---|---|---|
| 2026-11-19 13:00:00 | Bitcoin | 63,878.21 | -0.33% | -0.10% | 1.52% | 3.27% | -0.07% |
| 2026-11-18 13:00:00 | Bitcoin | 64,088.45 | -1.52% | -1.62% | -2.99% | 3.33% | 0.70% |
| 2026-11-19 13:00:00 | Ethereum | 1,806.26 | 0.60% | 0.89% | 2.73% | 4.66% | -0.17% |
| 2026-11-18 13:00:00 | Ethereum | 1,795.34 | -1.57% | -1.85% | -2.94% | 4.83% | 0.29% |
| 2026-11-19 13:00:00 | Binance Coin | 592.52 | 0.53% | 0.62% | 1.25% | 3.21% | 0.00% |
| 2026-11-18 13:00:00 | Binance Coin | 589.38 | -0.82% | -0.63% | -1.72% | 3.21% | 0.79% |
Cryptocurrency Capitalization and Volume
Major cryptocurrencies saw market caps fall on November 20, 2026. Bitcoin’s cap dropped 1.76% to $1,246,326,768,736, while its 24-hour volume climbed 7.91% to $32,992,892,739. Ethereum’s cap fell 1.12% to $214,757,268,287, with its volume up 4.32% to $10,722,565,366. Binance Coin fell 0.41% in capitalization to $76,275,624,373, and its volume dropped 9.11% to $560,711,305. Ripple’s cap fell 0.80% to $61,016,462,252, though its volume climbed 2.46% to $1,678,691,134. Tether, a stablecoin, saw a minimal 0.09% drop in capitalization to $175,098,410,205, with its volume up 4.92% to $48,036,663,594. Overall, major assets lost market value.
| Date | Cryptocurrency | Capitalization | Capitalization Variation | Volume | Volume Variation |
|---|---|---|---|---|---|
| 2026-11-20 00:00:00 | Binance Coin | 76,275,624,373 | -0.41% | 560,711,305 | -9.11% |
| 2026-11-19 00:00:00 | Binance Coin | 76,588,391,336 | -2.37% | 616,930,637 | -9.30% |
| 2026-11-18 00:00:00 | Binance Coin | 78,444,660,784 | 0.94% | 680,159,151 | 9.10% |
| 2026-11-20 00:00:00 | Bitcoin | 1,246,326,768,736 | -1.76% | 32,992,892,739 | 7.91% |
| 2026-11-19 00:00:00 | Bitcoin | 1,268,600,662,132 | -2.84% | 30,574,613,566 | -13.43% |
| 2026-11-18 00:00:00 | Bitcoin | 1,305,712,441,134 | 0.03% | 35,317,052,360 | 6.38% |
| 2026-11-20 00:00:00 | Ethereum | 214,757,268,287 | -1.12% | 10,722,565,366 | 4.32% |
| 2026-11-19 00:00:00 | Ethereum | 217,191,781,081 | -2.52% | 10,278,774,769 | -16.57% |
| 2026-11-18 00:00:00 | Ethereum | 222,809,331,072 | 0.13% | 12,319,776,946 | 8.06% |
| 2026-11-20 00:00:00 | Ripple | 61,016,462,252 | -0.80% | 1,678,691,134 | 2.46% |
| 2026-11-19 00:00:00 | Ripple | 61,508,412,854 | -1.52% | 1,638,312,205 | 1.13% |
| 2026-11-18 00:00:00 | Ripple | 62,458,780,202 | 2.98% | 1,619,935,745 | -5.04% |
| 2026-11-20 00:00:00 | Tether | 175,098,410,205 | -0.09% | 48,036,663,594 | 4.92% |
| 2026-11-19 00:00:00 | Tether | 175,253,102,803 | -0.03% | 45,781,985,391 | -15.43% |
| 2026-11-18 00:00:00 | Tether | 175,311,442,089 | -0.01% | 54,135,175,946 | 6.15% |
Cryptocurrency Exchanges Volume and Variation
Trading volumes across several major crypto exchanges climbed on November 20, 2026. Binance saw a significant 20.66% jump in volume, to 161,397, after a 6.36% rise on November 19. Coinbase also saw volume grow 11.51% to 29,903. KuCoin jumped 12.80% in volume, to 34,183, while OKX’s volume climbed 7.78% to 31,285. Bybit’s volume rose 4.28% to 34,077, and Crypto.com climbed 7.36% to 16,820. Gate.io’s volume was up 4.53% to 30,435. In contrast, Bitfinex’s volume fell 9.54% to 2,901, and Kraken’s volume stayed relatively stable, with a -0.13% change to 22,607. Binance US, despite a 41.15% increase, still had a relatively low volume of 566.
| Date | Exchange | Volume | Variation |
|---|---|---|---|
| 2026-11-20 00:00:00 | Binance | 161,397 | 20.66% |
| 2026-11-19 00:00:00 | Binance | 133,761 | 6.36% |
| 2026-11-18 00:00:00 | Binance | 125,767 | 6.44% |
| 2026-11-20 00:00:00 | Binance US | 566 | 41.15% |
| 2026-11-19 00:00:00 | Binance US | 401 | -11.28% |
| 2026-11-18 00:00:00 | Binance US | 452 | -24.67% |
| 2026-11-20 00:00:00 | Bitfinex | 2,901 | -9.54% |
| 2026-11-19 00:00:00 | Bitfinex | 3,207 | 9.87% |
| 2026-11-18 00:00:00 | Bitfinex | 2,919 | -20.27% |
| 2026-11-20 00:00:00 | Bybit | 34,077 | 4.28% |
| 2026-11-19 00:00:00 | Bybit | 32,679 | 2.66% |
| 2026-11-18 00:00:00 | Bybit | 31,833 | 5.02% |
| 2026-11-20 00:00:00 | Coinbase | 29,903 | 11.51% |
| 2026-11-19 00:00:00 | Coinbase | 26,817 | -7.72% |
| 2026-11-18 00:00:00 | Coinbase | 29,060 | -7.29% |
| 2026-11-20 00:00:00 | Crypto.com | 16,820 | 7.36% |
| 2026-11-19 00:00:00 | Crypto.com | 15,667 | -0.76% |
| 2026-11-18 00:00:00 | Crypto.com | 15,787 | 4.90% |
| 2026-11-20 00:00:00 | Gate.io | 30,435 | 4.53% |
| 2026-11-19 00:00:00 | Gate.io | 29,117 | -0.82% |
| 2026-11-18 00:00:00 | Gate.io | 29,359 | -1.12% |
| 2026-11-20 00:00:00 | Kraken | 22,607 | -0.13% |
| 2026-11-19 00:00:00 | Kraken | 22,637 | 6.47% |
| 2026-11-18 00:00:00 | Kraken | 21,261 | -6.35% |
| 2026-11-20 00:00:00 | KuCoin | 34,183 | 12.80% |
| 2026-11-19 00:00:00 | KuCoin | 30,305 | -7.78% |
| 2026-11-18 00:00:00 | KuCoin | 32,862 | 10.67% |
| 2026-11-20 00:00:00 | OKX | 31,285 | 7.78% |
| 2026-11-19 00:00:00 | OKX | 29,027 | 1.00% |
| 2026-11-18 00:00:00 | OKX | 28,741 | -11.60% |
Mining – Blockchain Technology
Bitcoin mining difficulty stayed constant at 134.82T from November 16 to November 20, 2026, after a -9.13% decrease on November 15. The number of blocks mined steadily climbed, hitting 976.66K on November 20, 2026, with a consistent 0.02% daily variation over the past few days. The reward per BTC block held steady at 3.13 BTC, with no variation throughout the period. The hash rate, the network’s computational power, fluctuated. On November 20, 2026, the hash rate was 1.03T GB, a -2.48% decrease from the previous day, following a 5.00% increase on November 19 and a -9.09% drop on November 18. These shifts suggest dynamic changes in mining participation and network processing power.
| Item | 2026-11-20 | 2026-11-19 | 2026-11-18 | 2026-11-17 | 2026-11-16 | 2026-11-15 | 2026-11-14 |
|---|---|---|---|---|---|---|---|
| Difficulty | 134.82T | 134.82T | 134.82T | 134.82T | 134.82T | 134.82T | 148.36T |
| Difficulty Variation | 0.00% | 0.00% | 0.00% | 0.00% | 0.00% | -9.13% | 0.00% |
| Blocks | 976.66K | 976.50K | 976.35K | 976.20K | 976.03K | 975.86K | 975.73K |
| Blocks Variation | 0.02% | 0.02% | 0.02% | 0.02% | 0.02% | 0.01% | 0.01% |
| Reward BTC | 3.13 | 3.13 | 3.13 | 3.13 | 3.13 | 3.13 | 3.13 |
| Reward BTC Variation | 0.00% | 0.00% | 0.00% | 0.00% | 0.00% | 0.00% | 0.00% |
| Hash Rate GB | 1.03T | 1.05T | 1.00T | 1.10T | 1.15T | 911.91B | 834.06B |
| Hash Rate GB Variation | -2.48% | 5.27% | -9.15% | -4.56% | 26.49% | 9.33% | -5.76% |
Taking stock
The crypto market is navigating a period of pronounced investor caution, shown by consistent ‘extreme fear’ readings from the Fear and Greed Index on November 20, 2026. This sentiment is driving tangible market movements, particularly in the capitalization of major digital assets.
While some exchanges report increased trading volumes, this activity seems tied to selling pressure, seen in falling market caps for Bitcoin, Ethereum, and Ripple. Bitcoin’s capitalization dropped 1.76% on November 20, 2026, a trend other leading cryptocurrencies mirrored. This suggests higher trading volumes might reflect investors exiting positions, not accumulating new ones.
The significant outflows from Bitcoin ETFs, totaling $975 million on November 19, 2026, and nearing $2.9 billion for the month, show a retreat of institutional capital. This withdrawal of funds from investment products is a key factor in the prevailing bearish sentiment and could keep influencing market direction in the short term.
So What
For those observing the crypto market today, the pervasive ‘extreme fear’ sentiment, with Fear and Greed Index values around 12 points on November 20, 2026, points to a heightened risk-off environment. This isn’t a time for speculative entries without careful thought.
The declining market caps of major assets like Bitcoin (-1.76%) and Ethereum (-1.12%) on November 20, 2026, means existing holdings are likely losing value. Investors with open positions should note this downward pressure. The increase in trading volumes on exchanges like Binance (up 20.66%) could signal selling activity, which would further depress prices.
The substantial Bitcoin ETF outflows, nearing $2.9 billion for November, signals a lack of institutional confidence. This trend suggests large-scale buyers are on the sidelines or actively withdrawing capital, removing a significant source of market demand. This implies price recovery may be challenging in the immediate future.
What next?
Over the next 8 hours, market participants should watch the Consumer Sentiment Index, a moderate impact economic event scheduled for 15:00:00 on November 20, 2026. The report’s outcome could influence broader market sentiment and potentially impact crypto prices.
Watch for any significant shifts in the Fear and Greed Index, currently at ‘extreme fear’ (e.g., 12pt from Alternative.me on November 20, 2026). A move towards higher values (above 24 points) could signal a slight easing of fear, but we’d need a sustained shift to indicate a trend change.
Keep an eye on Bitcoin’s price levels. Recent news indicates a slump below $62,000 and even $61,300. Any sustained move back above the $64,000 mark would strongly signal a potential short-term recovery, though the broader trend remains down.
Disclaimer – Informational Content, Not Investment Advice
Content provided herein is solely for informational purposes and should not be construed as a recommendation, endorsement, or suggestion to engage in any form of investment activity. The information presented in this post is not intended to serve as financial, legal, tax, or investment advice.
About the Author: CryptoTrends Team
With over five years of diving deep into cryptocurrencies and blockchain, we’ve cemented our position as experts in the digital currency realm. Our team has not only contributed to a multitude of pioneering blockchain projects but has also enlightened thousands with our incisive articles CryptoTrends. Always at the cutting edge of crypto trends, we proudly collaborate with CryptoBotStation, ensuring our readers stay one step ahead in this dynamic space.